
How can the significant undervaluation of NTG Clarity Networks be explained?

The capital markets frequently exhibit periods of significant dislocation between the operational reality of a corporation and its perceived value, particularly within the micro-cap technology sector. NTG Clarity Networks Inc. (TSXV: NCI) represents a definitive instance of such mispricing, where a consistent trajectory of triple-digit earnings growth and aggressive revenue expansion is met with a compression in valuation multiples that defies traditional fundamental analysis. As of early 2026, the equity trades at a trailing price-to-earnings ratio that sits significantly below its peers and its own historical benchmarks, despite achieving eighteen consecutive quarters of last-twelve-months revenue growth. This analysis explores the convergence of macroeconomic tailwinds in the Gulf region, the high-margin scalability of an offshore delivery model, and the technical disconnects in the share structure that have resulted in what appears to be a systemic undervaluation of the enterprise.

Macroeconomic Context and the Saudi Arabian Digital Catalyst
The primary engine of growth for the enterprise is the Kingdom of Saudi Arabia, which accounts for approximately 95% of total revenue. To understand the mispricing of the entity, one must first quantify the scale of the digital transformation market within the Middle East. Under the auspices of Vision 2030, Saudi Arabia is undergoing a $1.3 trillion investment-driven economic shift aimed at reducing oil dependency and fostering a knowledge-based economy. This shift has created an insatiable demand for IT infrastructure, software development, and digital process automation.
The ICT market in Saudi Arabia is projected to reach $76.05 billion by 2029, growing at a compound annual growth rate of 8.5%. The enterprise’s growth has vastly outpaced this market average, achieving a three-year revenue CAGR of over 60%. This outperformance suggests a widening of the company’s competitive moat, built on a 20-plus-year track record in the region.
The mispricing is partly a result of market participants viewing this geographic concentration as a liability rather than a localized competitive advantage. While single-country reliance typically warrants a risk premium, the specific nature of the Saudi market, characterized by massive government-led mandates and high barriers to entry for unproven firms, suggests that the enterprise’s deep integration with leading banks, telecoms, and government entities creates a level of revenue defensibility that is not currently reflected in its valuation.
The Egypt-Based Delivery Model: A Structural Margin Advantage
A core component of the enterprise’s operational efficiency is its “Canadian-led, Egypt-based, Saudi-focused” business model. By utilizing a workforce of over 1,300 professionals primarily based in its Egypt Offshore Centre, the company manages to bypass the high labor costs associated with onsite IT consulting in the Gulf. This labor arbitrage allows the company to offer digital transformation services at a 50% discount to traditional onsite models while simultaneously enjoying higher profit margins.
The scaling of the Egypt offshore center has been a primary driver of the record financial performance observed in the 2024 and 2025 fiscal cycles. In the first quarter of 2025, revenue from offshore services grew by 268% year-over-year. The implications of this model extend beyond simple cost-cutting; it provides the enterprise with a rapid project deployment capability that is critical for securing Tier 1 clients such as GE, Ericsson, Nokia, and Vodafone.
The financial market’s failure to re-rate the company’s stock suggests a lack of appreciation for this margin-expansion mechanism. As the revenue mix shifts more heavily toward offshore delivery and proprietary software, the historical valuation multiples, often pegged to lower-margin staffing or consulting firms, become increasingly obsolete.
Proprietary Software and the NTGapps Pivot
One of the most significant qualitative developments in the enterprise’s recent history is the aggressive adoption of its proprietary no-code platform, NTGapps. Historically viewed as a services firm, the company is successfully transitioning into a hybrid software-and-services provider. The growth metrics for the software division are particularly anomalous when compared to the company’s static share price.
In the second quarter of 2025, NTGapps revenue surged by 1,600% year-over-year, accounting for 21% of the total quarterly revenue. This was followed by a 650% increase in the third quarter of 2025. The shift toward software is a key value driver, as proprietary platforms typically command much higher valuation multiples (EV/Revenue and P/E) than professional services.
The integration of no-code enterprise application templates and a workflow rule engine allows organizations to accelerate their digital transformation without the need for extensive traditional coding cycles. This product-market fit is especially strong in the Middle Eastern utility and telecom sectors, where the enterprise’s Utility Billing (NTS) and Network Inventory System (NIS) are already established. The market has yet to apply a “SaaS-lite” or high-growth software multiple to the enterprise, preferring instead to value it on a trailing earnings basis that heavily discounts the future cash flows of the software segment.
Financial Performance: 2024–2025
The financial results for the 2024 fiscal year were transformative, setting a baseline for the high-growth trajectory currently being executed. Annual revenue grew by 102% to $56.1 million, and net income rose by 326% to $9.9 million. This performance was driven by a 90% customer retention rate and the fact that 54% of existing customers expanded their services.
The momentum continued through 2025, as evidenced by the quarterly performance data:
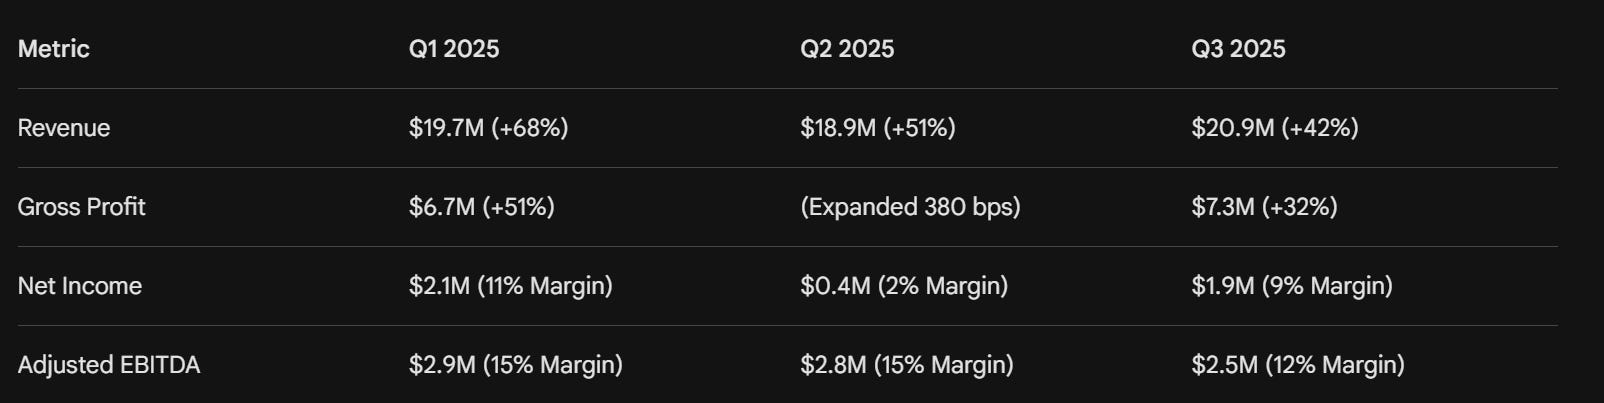
The decline in net income in Q2 2025 and the subsequent margin fluctuations in Q3 2025 are critical to understanding the current mispricing. In Q2, the company saw a significant increase in G&A expenses, which rose to 17% of revenue compared to 8% in the prior year. This was largely a result of strategic investments in hiring and sales infrastructure to support the massive $105 million backlog.
Furthermore, 2025 marked the first year the company began paying material corporate taxes, with a $1.2 million income tax provision in Q1 and a $595,000 accrual in Q3. The stock market reacted negatively to these “headline” profit declines, with the share price falling 17.05% following the Q2 announcement despite record revenue. This reaction suggests a short-term bias in the retail investor base that fails to distinguish between structural margin decay and strategic, growth-oriented reinvestment.
Detailed Contractual Analysis and Backlog Visibility
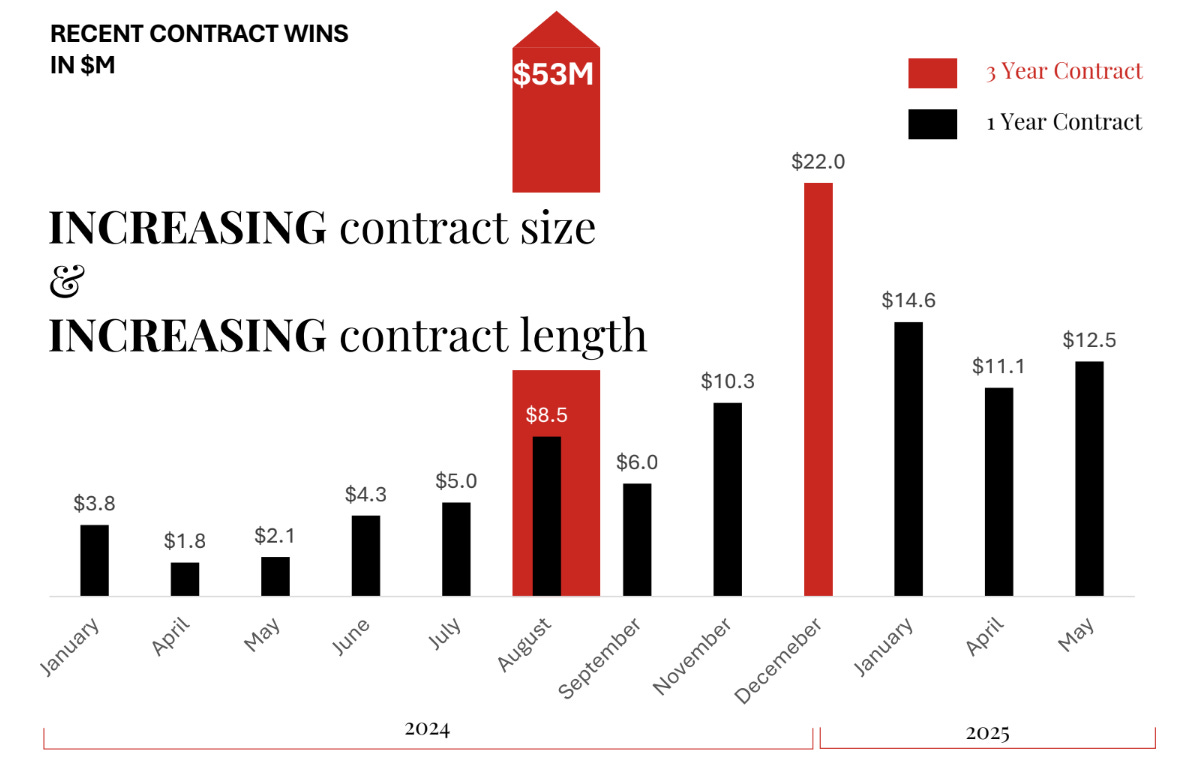
To understand the durability of the current revenue growth, one must examine the granularity of the enterprise’s contract wins throughout 2025. Unlike many micro-cap companies that rely on one-off project work, NTG Clarity has successfully transitioned its business model toward multi-year framework agreements. These agreements provide a “spending ceiling” that the customer can draw upon as needed, creating a stable, high-visibility revenue stream that typical consulting firms lack.
In March 2026, the company announced a three-year framework agreement with a major Saudi real estate development company. This contract is illustrative of the enterprise’s “springboard” strategy; by securing a foothold in the Kingdom’s massive real estate and infrastructure sector, driven by projects like NEOM and the Red Sea Development, the company positions itself for decades of digital maintenance and expansion work.
The $88 Million Backlog Structure
As of the 2025 Q3 report, the backlog exceeded $88 million, with +$50 million of that secured against three-year contracts. The relevance of this backlog cannot be overstated in a valuation context. For a company with a current market capitalization of approximately $44 million, having a contracted backlog that is more than double its enterprise value is a significant indicator of mispricing.
The market appears to be discounting this backlog due to perceived “execution risk.” However, the company’s 90% customer retention rate suggests that execution risk is historically low. When 63% of customers are actively increasing their service levels, it indicates that the enterprise has successfully embedded itself into the “critical path” of its clients’ operations.
Operational Reinvestment and Margin Dynamics
A frequent critique from the market in late 2025 was the compression of Adjusted EBITDA margins, which fell to 12% in Q3 2025 compared to 22% in the prior year. However, a nuanced reading of the financials reveals that this was a deliberate choice by management to reinvest in “specialized talent”.
In a labor-constrained IT market, hiring 1,300+ professionals is a significant capital allocation move. In Q3 2025, the company hired new employees who were expected to be deployed on new contracts toward the end of the year. This creates a temporary “margin drag” where salaries are paid before the corresponding revenue is recognized.
The Impact of Corporate Tax Transition
The enterprise’s historical lack of tax liability was a significant tailwind that began to fade in 2025. The $595,000 tax accrual in Q3 2025 alone represented nearly 3% of revenue. Investors often value companies on “after-tax” earnings, and the transition to a 20-25% effective tax rate essentially requires the company to grow its pre-tax income by 25% just to stay flat on a net basis.
The mispricing persists because the market has not yet “normalized” the company’s earnings power. If one applies a 15x multiple to the company’s pre-tax earnings, a common practice for high-growth firms in tax-transition phases, the valuation would be significantly higher.
Given Q3 2025 pre-tax income was healthy despite investments, the enterprise is generating sufficient cash flow to fund its own expansion without further dilution, a rarity in the micro-cap tech space.
Geographic Diversification: Iraq and UAE Expansion
To mitigate the 95% Saudi concentration risk, management has established corporate entities in Dubai and Baghdad. The expansion into Iraq is particularly notable, as the country is beginning its own digital transformation journey in the government and telecommunications sectors.
The Iraq market represents a high-risk, high-reward opportunity that utilizes the same Egypt-based delivery model. Because the Egypt offshore center is geographically and culturally proximate to Iraq and the UAE, the enterprise can maintain its cost advantage while expanding its total addressable market (TAM).
The market’s failure to price in this diversification reflects a “wait and see” approach. However, by the time these regions represent 20-30% of revenue, the stock will likely have already re-rated, leaving current investors with the “mispricing alpha.”
Capital Structure and the Valuation Gap
The share structure of the enterprise has undergone significant changes that complicate the valuation for casual observers. In March 2024, the company executed a 1-for-5 share consolidation, reducing the outstanding shares from approximately 187 million to 37.5 million. This move was intended to improve the share price and attract more institutional interest.
The most glaring evidence of mispricing, however, is the July 2025 “Listed Issuer Financing Exemption” (LIFE) offering. The company successfully raised $9 million by issuing units at a price of $2.20 per unit. Each unit consisted of one common share and a half-warrant exercisable at $2.95.
As of March 2026, the stock trades at approximately $0.93. This represents a staggering 57.7% discount to the price that institutional and accredited investors paid only months prior during the LIFE offering.
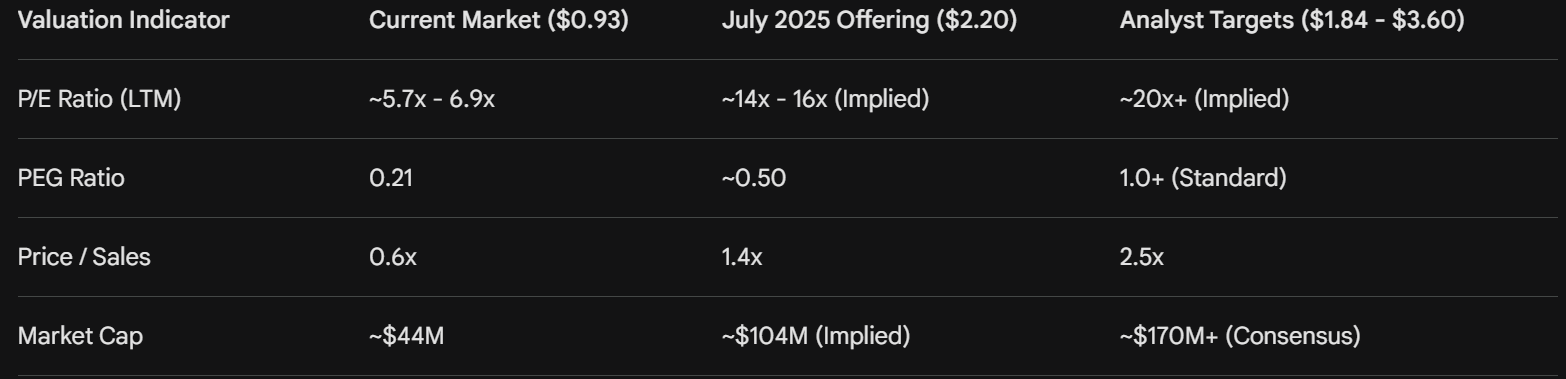
A PEG ratio of 0.21 is virtually unheard of for a company with consistent double-digit revenue growth and high recurring revenue. In efficient markets, a PEG ratio typically trends toward 1.0. The enterprise’s current PEG suggests that investors are essentially receiving the company's growth at an 80% discount to its fundamental value.
Quantitative Modeling of Undervaluation
To further illustrate the degree of mispricing, the Graham Formula for valuation can be applied. The formula is traditionally expressed as:

Where V is the intrinsic value, EPS is the trailing twelve-month earnings per share, and g is the expected long-term growth rate. Given an EPS of $0.14 and an estimated growth rate of 34.62% :

While the Graham Formula is notoriously aggressive for growth stocks, even adjusting the constants for a more conservative profile yields a valuation significantly higher than $0.93. For instance, using a more conservative P/E base of 7.0 and a halved growth multiplier:

Regardless of the model used, the intrinsic value of the enterprise consistently places it in the $2.00 to $4.00 range, aligning with the $3.60 consensus target and the $3.30 target issued by Canaccord Genuity. The market price of $0.93 implies a total cessation of growth or a catastrophic failure that the company’s current $105 million backlog and 90% customer retention do not support.
Technical and Behavioral Factors Driving the Disconnect
If the fundamentals are so robust, the question remains: why is the stock mispriced? Several technical and behavioral factors appear to be creating a “liquidity trap” for the equity.
1. Exchange and Liquidity Constraints
Trading on the TSX Venture Exchange limits the stock’s visibility to major institutional funds and retail investors outside of Canada. Micro-cap stocks with market capitalizations under $50 million often suffer from low daily trading volumes (e.g., 63.8k shares), which means even small sell orders can depress the price significantly.
2. Relative Strength and Momentum Decay
The stock has exhibited poor technical momentum, with a one-year price change of approximately -49%. Behavioral finance suggests that retail investors are often “momentum chasers”; a declining share price creates a negative feedback loop where investors sell based on the price trend rather than the underlying business performance. The enterprise’s RSI of 33.64 indicates that the stock is currently in or near “oversold” territory.
3. Tax Normalization Misinterpretation
As mentioned, the introduction of corporate taxes in 2025 reduced the “Net Income” figure while the “Pre-tax Income” and “EBITDA” remained strong. Investors who rely solely on screeners for “Net Income Growth” may see a deceleration and exit the position, unaware that the core operational profitability is still expanding.
4. Insider Activity Perception
While there has been no major insider selling reported recently, the lack of aggressive insider buying during the recent dip can sometimes be misinterpreted by the market as a lack of confidence. However, with insiders like Ashraf Zaghloul already owning over 24% of the company, the ownership concentration is already high.
Sector Comparison: Converge Technology Solutions and Plurilock Security
A peer-group analysis further highlights the mispricing. Within the Canadian technology landscape, companies like Converge Technology Solutions (CTS) and Plurilock Security (PLUR) operate in adjacent sectors (IT services and cybersecurity).
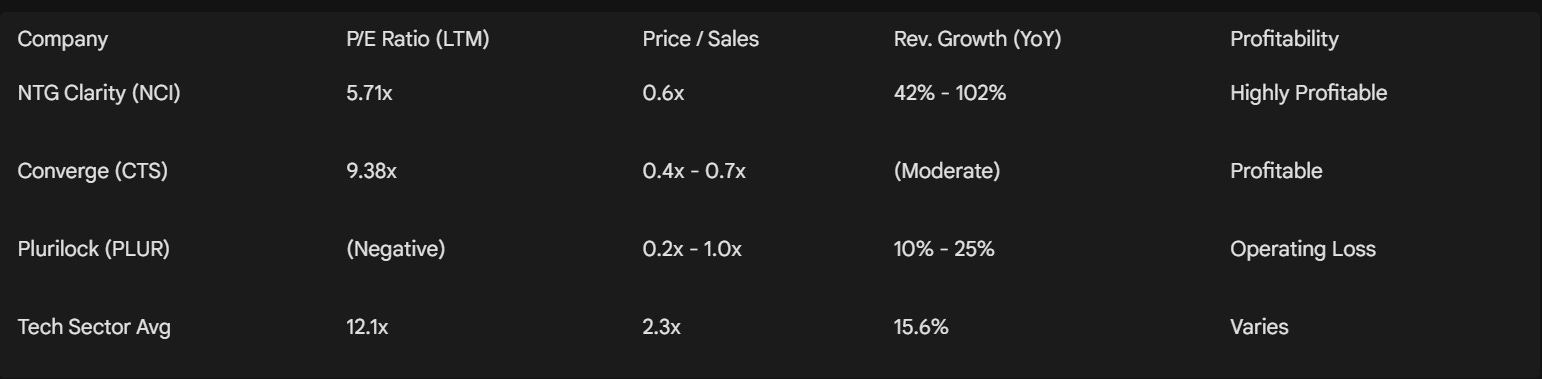
Converge, while having a much larger market cap, trades at a higher P/E multiple despite slower organic growth. Plurilock, which is currently operating at a net loss, trades at a similar or higher Price/Sales multiple in certain periods, highlighting the market’s willingness to value loss-making growth while ignoring profitable, cash-generative growth in the case of NTG Clarity.
The “Quality Score” for the enterprise is reported at 53.09, which is average, but its “Value Score” is a remarkable 94.47. This suggests that relative to the global universe of over 45,000 stocks, NTG Clarity is among the top 6% of undervalued companies based on fundamental metrics.
The AI Strategy and Future Outlook
The enterprise is not standing still while waiting for the market to realize its value. In early 2026, the company provided an update on its Artificial Intelligence strategy, signaling a move to integrate AI into its digital transformation solutions. This includes the Peaktify partnership and the expansion of the “StageEM” enterprise project management software.
Expansion into other Gulf markets, such as Iraq and the UAE, aims to reduce the geographic concentration risk that currently weighs on the valuation. The company’s ability to sign a three-year frame agreement with a brand-new government IT customer in Q3 2025 further validates its regional reputation.
As the company works toward its full-year 2025 revenue guidance of approximately $78 million, with an Adjusted EBITDA margin target of 16-20%, the cash-generative nature of the business will become impossible to ignore. Operating cash flow is expected to improve as the timing of accounts receivable for large Saudi projects normalizes.
Conclusion: The Case for a Valuation Re-rating
The synthesis of available data points toward a profound mispricing of NTG Clarity Networks. The enterprise exhibits the growth characteristics of a high-flying tech firm, 102% annual revenue growth, 1600% software revenue surges, and a $88M+ backlog, yet it is valued like a distressed or stagnant service business with a 6x P/E ratio.
The disconnect between the $2.20 price paid by institutional investors in July 2025 and the current $0.93 market price represents a failure of the public market to accurately process the company’s 2025 financial results. While the introduction of taxes and growth-related G&A increases have temporarily masked net income growth, the underlying pre-tax performance and revenue trajectory remain exceptional.
For the mispricing to correct, the enterprise must continue to demonstrate the scalability of its NTGapps platform and maintain its 18-quarter growth streak. As the visibility of the $1.3 trillion Saudi digital transformation continues to increase globally, the “Middle Eastern digital transformation pure-play” is likely to undergo a significant re-valuation toward its peers and analyst targets, which represent a potential upside of 200% to 280% from current levels.
Disclaimer & Legal Notice
These analyses are designed to supplement your own due diligence. Unless otherwise stated, the opinions expressed herein are based exclusively on the company’s financial performance as detailed in its most recent regulatory filings.
This analysis is conducted solely to support the retail investor community. I receive no compensation of any kind from the companies analyzed.
This content is provided for informational purposes only and reflects a personal opinion. It does not, under any circumstances, constitute financial advice. It is essential that every reader conducts their own thorough research and, if necessary, consults a licensed financial advisor before making any investment decisions.
Momentum is powerful not only on the way up but also to the way down. Especially in Microcaps.
The most glaring issue here is the lack of insider buying or the lack of a buyback program at these levels. As you pointed out, valuation is extremely depressed and the company had the best liquidity position ever ($27M current assets vs $9M current liab). Nearly all current assets are in A/R and Cash. At these levels a $4M buyback program takes out 10% of the share count.
The lack of action leads to speculations that do not contribute to the already depressed share price. Amateur hour